NOTE: This project has taken a new life with the Mindboggle software project:
https://github.com/nipy/mindboggle/blob/master/mindboggle/mio/colors.py
In the original project, we compute color assignments for regions, such as those in a 2-D or 3-D brain image.
The optimization uses a brute force strategy to maximize the distinguishability of adjacent regions
while simultaneously choosing perceptually similar colors for groups of regions.
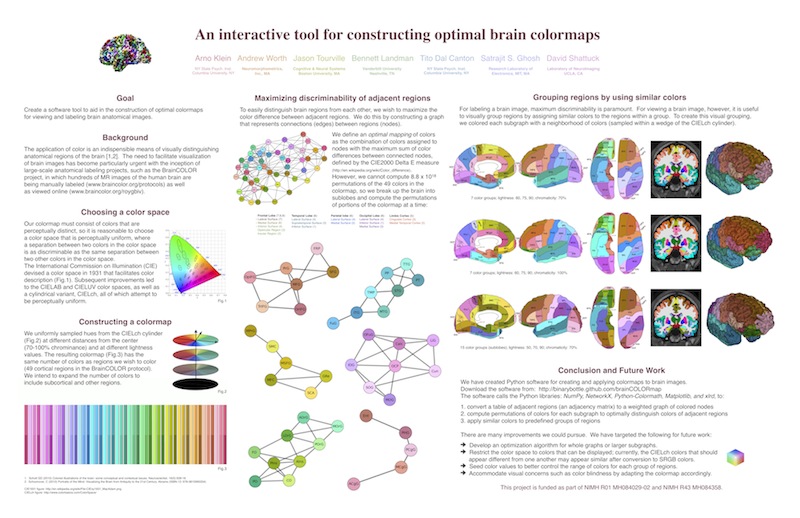
We presented a poster at the Society for Neuroscience 2010 conference describing
"An interactive tool for constructing optimal brain colormaps"
Arno Klein, Andrew Worth, Jason Tourville, Bennett Landman, Tito Dal Canton, Satrajit S. Ghosh, David Shattuck.
Software
The software and example input & output are on braincolor's GitHub repository.
braincolors.py takes in an Excel file with an adjacency matrix, where each value signifies adjacency between regions, and outputs the optimal assignment of colors to each group of regions on the command line, where optimal means maximally distinguishable colors within a neighborhood of similar colors in a color space:
- Read in an Excel file with a binary (or weighted) adjacency matrix, where each row or column represents a region, and each value signifies whether (or the degree to which) a given pair of regions are adjacent. Example: (a) column 0 = region abbreviation (b) column 1 & row 0 = full region name (c) column 2 = group number (each region is assigned to a group)
- Create a colormap for the number of regions, with hues that are sampled from the (approx. perceptually uniform) CIELch cylindrical color space.
- Convert the matrix from #1 to a graph, where each node represents a region and each edge represents the adjacency value between its connected nodes.
- Break up the graph in #3 into subgraphs, where each subgraph represents a group of adjacent regions (assigned the same group number in #1c).
- Compute every permutation of colors for the nodes of each subgraph in #4, with adjacent colors in the color space.
- Assign each edge in each subgraph the value of the color difference between the colors assigned to its pair of connected nodes in #5. (Multiply the connection matrix for each subgraph by the color difference matrix for each permutation.)
- Find the optimal colors for the subgraph nodes that maximizes the sum of the edge values from #6.
- Plot the colormap, the whole graph, or individual colored subgraphs.
-
Optional: Replace RGB colors in an XML file.
The program recolor_eps.[csh,py] takes the output XML to recolor EPS files.
Also, see PerceptVis